

Risk management is a central concept that governs your attitude to the assets you trade and how you go about it. Learn the types of risk to consider, along with common risk management techniques, effective risk management tools, and more.
Risk management in trading refers to the methods used to protect capital and minimise losses, and is undertaken both before and during management of positions. Risk management strategies in CFD trading take many forms, from market risk and credit risk to liquidity risk, and all of them pose potential threats to your capital and market activities.
Whether using a stop-loss, considering your position size in line with volatility conditions, or weighing up how much risk you’re willing to take on in general, having a keen understanding of the various factors that make up a comprehensive risk management plan is a must for serious traders.
It’s not only the risk of losing capital when a trade goes against you that should concern you. From liquidity risk to operational risk, here’s a comprehensive list of the risk types out there with margin trading, how they are defined, and how to understand them.
Market risk: market risk, also known as systematic risk, refers to the risk of losses resulting from adverse movements in asset prices. Fundamental factors such as changes in interest rates, economic indicators, geopolitical events, and overall market sentiment are examples of the type of events that can influence price moves. Market risk affects all securities and cannot be diversified away.
Liquidity risk: this is the risk of being unable to buy or sell an asset quickly at its current market price due to insufficient trading volume. Illiquid assets, which might include certain agricultural products, lesser-known metals, or exotic currency pairs, often have wider bid-ask spreads and higher transaction costs, meaning trades may not be executed at desired prices. This is known as slippage. In such circumstances, you may want to use guaranteed stops to assure the position is closed at the exact price you want. However, if your guaranteed stop is activated, you’ll pay a fee for this assurance.
Credit risk: credit risk, also known as counterparty risk, arises when the other party involved in a trade fails to fulfil their contractual obligations. It’s possible that counterparties may default on their obligations, leading to financial losses for the trader, making it crucial to minimise this risk by choosing a regulated, trusted broker.
Operational risk: operational risk comes from internal processes, systems, or human error within trading operations. This includes errors in order execution, technological failures, cybersecurity breaches, and compliance issues. Operational risk can disrupt trading activities and result in financial losses. Again, ensuring your broker has a reputation for reliable execution and solid operational processes will be useful.
Model risk: model risk arises when trading decisions are based on flawed or inaccurate models, algorithms, or quantitative strategies. Traders rely on various models for risk assessment, forecasting, and trading strategies, and errors in these models can lead to unexpected losses.
Regulatory risk: regulatory risk refers to the risk of adverse changes in regulations or compliance requirements that affect trading activities. Regulatory changes may impact market structure, trading rules, margin requirements, and reporting obligations, influencing trading strategies and the availability of derivative products.
Event risk: event risk encompasses unexpected events or developments that can significantly impact financial markets, such as natural disasters, terrorist attacks, political upheavals, or corporate scandals. These events can cause market volatility and disrupt trading strategies.
Country risk: also known as sovereign risk, this risk type is associated with trading assets denominated in foreign currencies or issued by foreign governments. Factors such as political instability, economic downturns, and currency fluctuations can affect the value of these assets.
Concentration risk: concentration risk arises from having a large portion of trading capital invested in a single asset, sector, or market. Lack of diversification increases vulnerability to adverse price movements in specific assets or market segments. Hence, it’s always advisable to spread your trading across diverse instruments with different risk profiles, in order to minimise the impact of extreme price fluctuations across single assets.
Psychological risk: psychological risk refers to the emotional and cognitive biases that can influence trading decisions. Fear, greed, overconfidence, and herd behaviour can lead traders to deviate from their rational trading strategies, resulting in poor decision-making and increased risk exposure. It’s always worth it to factor psychological risk into your trading plan, and to consider ways to ensure you’re trading in the right frame of mind when it matters most.
Risk management is important in trading because applying it effectively can help preserve funds and prolong your trading career. Trading is risky and markets can be volatile, meaning conditions can vary wildly across assets and market conditions. Managing risk well means maintaining consistency in your trading performance, helping you in your trading strategy and giving you the best chance to achieve your financial goals.
You can manage your risk when trading in various ways depending on the risk presented. Perhaps the most common way will be to apply carefully-thought-out stop-losses to mitigate market risk, but other risk management strategies include hedging, backtesting and maintaining a consistent emotional state to minimise impulsive decision-making. You can practise your trading risk-free with us by opening a demo account.
Type of risk | Potential risk management solution |
Market risk | Apply a stop-loss to limit the downside of a trade. |
Liquidity risk | Diversify your portfolio across risk-on and risk-off assets. |
Credit risk, operational risk | Trade with reputable brokers with strong credentials across compliance and trading operations. |
Model risk | Validate and backtest trading models rigorously before deployment, and regularly reassess and adjust them to account for changing market conditions. |
Regulatory risk | Stay informed about regulatory changes in the jurisdictions where you operate and ensure compliance with all relevant regulations. |
Event risk | Use hedging strategies to protect against unexpected events that could impact markets. |
Country risk | Diversify your investments across different countries to reduce exposure to any single country’s economic or political risks. |
Concentration risk | Avoid overexposure to any single asset or sector by diversifying your portfolio. |
Psychological risk | Practise disciplined trading strategies, maintain emotional control, and consider using techniques like meditation or journalling to manage stress and emotions during trading. Additionally, setting predefined trading rules and sticking to them can help mitigate impulsive decision-making. |
Risk management strategies refer to plans to manage all types of risk. Your strategy will need to identify any applicable risk to your trading activity, such as those outlined in the section above, and then evaluate their likelihood in various scenarios by drawing up a comprehensive assessment.
With that written down, you’ll be in a position to better avoid and reduce risks when they present themselves. It’s important to monitor your risk management strategy and adjust as needed based on market conditions, your own risk tolerance, and other factors.
Find out more on trading strategies with our technical analysis guides as well as our general trading strategy guides, incorporating timeframe analysis, fundamental analysis, trading vs investing, and more.
Risk management tools can be defined as technical instruments like stop-loss orders crucial in derivatives trading to protect against significant losses. Here are some common risk management tools used in CFD trading:
Stop-losses automatically close a trade when the market moves against you by a specified amount. This helps to limit potential losses. Stop losses can be fixed in place, or trailing (see below).
These close a trade when the market moves in your favour by a specified amount, securing profits before the market can reverse.
This is a more secure version of the stop-loss order, guaranteeing to close the trade at the specified price, regardless of market volatility or gaps. GSLOs are subject to a fee if activated. For more information, please see the fees and charges page.
Trailing stops adjust the stop-loss level as the market price moves in your favour (IE, up for a long trade, and down for a short trade), locking in profits while still protecting against adverse price movements.
Managing the amount of leverage used in trading can ensure it’s within a comfortable risk level. This can prevent margin calls and the forced closure of positions. You can adjust your leverage on Capital.com for different asset classes by clicking the ‘Live’ button in the top right of the platform screen. Then, click ‘My accounts’ and you’ll find the leverage toggle in the ‘Trading options’ icon in each live account you hold.
Hedging refers to opening new positions to offset potential losses from existing positions. This can help manage risk exposure in volatile markets.
This refers to determining the appropriate amount of capital to allocate to each trade to ensure that no single trade can significantly impact the overall portfolio.
Diversification entails spreading investments across various assets or markets to reduce exposure to any single asset or market risk.
Assessing the potential risk versus the expected reward for each trade to ensure it meets predetermined risk management criteria. For more information, take a look at our risk-reward ratio page.

Continuously monitoring market conditions and reviewing trading strategies and positions to adjust risk management techniques as necessary.
Setting up alerts to notify traders of significant market movements or conditions that could affect their positions, allowing them to take timely action.
Having a comprehensive trading plan that includes risk management strategies and adhering to it strictly to avoid emotional decision-making.
Using these tools effectively helps CFD traders manage their risk exposure and improve their chances of long-term success in the markets.
Rather than trading individual stocks, traders use indices to gain broader market exposure. Index prices rise or fall based on the weighted average performance of their constituent stocks, as well as broader market trends.
With indices, traders can speculate on the overall direction of an economy or sector, hedge existing positions, or take advantage of market volatility – all without needing to analyse or manage multiple single-stock positions.
Indices are broadly grouped into categories based on how they are constructed and what they represent, which includes: national indices, sector indices, volatility indices, and currency indices.
National indices track the performance of a selection of companies listed in a specific country. These include major benchmarks like the US 500 (S&P 500), UK 100 (FTSE 100), Germany 40 (DAX 40), and Japan 225 (Nikkei 225). Most national indices are weighted by market capitalisation, meaning larger companies have a greater impact on index price movements. Others, such as the US Wall Street 30 (Dow Jones), are price-weighted, where higher-priced stocks carry more influence.
Sector indices focus on particular segments of the economy, such as technology, energy, or healthcare. These indices reflect the performance of companies within a specific industry. . For example, the Hong Kong Tech Index tracks major technology firms listed in Hong Kong, while other indices may focus on financials, industrials, or consumer goods.
Volatility indices, such as the Volatility Index (VIX), measure implied market volatility. These are based on the pricing of options and do not track company shares directly. They can help gauge market sentiment or hedge against risk.
Currency indices track the performance of a single currency against a weighted basket of others. For instance, the US Dollar Index (DXY) measures the value of the US dollar relative to six major currencies, including the euro, Japanese yen and British pound, with the euro carrying the heaviest weighting. Forex traders might use currency indices to assess currency strength or to hedge exposure.
Indices are traded using derivatives such as contracts for difference (CFDs), wherein traders speculate on price movements without owning the underlying shares. Here’s how indices trading works.
When trading indices, you can take a long position if you believe the index will rise, or go short if you expect it to fall. For example, a trader expecting the US 500 to increase might go long using a CFD, aiming to profit from upward price movement. If the index falls instead, the trader would incur a loss.
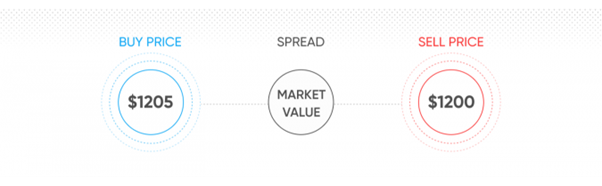
The primary cost of trading indices is the spread – the difference between the buy and sell price. You pay the spread when opening a position. There may also be overnight fees if you hold positions beyond the trading day, or additional charges for using risk management tools such as guaranteed stop-losses.
Each index has its own weighting method. Capitalisation-weighted indices – like the Germany 40 – give more influence to larger companies. Price-weighted indices, such as the US Wall Street 30, are influenced more by stocks with higher share prices, regardless of company size.
Index CFDs are traded on margin. This means you only need to deposit a fraction of the trade’s full value to open a position. While this can increase potential returns, it also magnifies potential losses, so it’s important to use it with caution.
Major indices can experience high liquidity, especially during their core trading hours. High liquidity can result in tighter spreads and faster execution, making it easier to enter or exit trades at intended prices. However, periods of high volatility can still lead to slippage due to rapid price movements, even in otherwise liquid markets.
Indices can be traded via most CFD trading platforms on desktop or mobile. While trading may be available outside standard exchange hours, indices are typically most active during local market hours – for example, the US 500 is most active when US markets are open.
Now let’s say you want to trade a CFD on the same market at a price of 16,000.
After conducting some fundamental analysis on the market, this time you think it will fall.
You open a short CFD position at €10 per point. This gives you a notional exposure of €160,000 (16,000 × €10). With a 5% margin requirement, you only have to put down €8,000.
Over a few hours, the price rises by 40 points to 16,040 and you close the position.
You’ve made a loss of €400 (40 × €10), plus the spread and any overnight funding charges, if applicable.
Conversely, had the price moved in line with your view and fallen 40 points to 15,960, the same position would have delivered a €400 profit, plus any applicable charges.
Indices trading hours depend on the local market hours of the underlying stock exchange. Here are the market trading hours (in UTC) for several major indices:
Index | Exchange hours* | Our hours (via CFDs)** |
US 500 | 1:30pm – 8pm | Sunday 12am – Friday 9pm |
US Tech 100 | 1:30pm – 8pm | Sunday 12am – Friday 9pm |
UK 100 | 7am – 3:30pm | Sunday 12am – Friday 9pm |
Germany 40 | 7am – 3:30pm | Sunday 12am – Friday 9pm |
Japan 225 | 12am – 6am | Sunday 12am – Friday 9pm |
Australia 200 | 11pm – 5am | Sunday 12am – Friday 9pm |
*Monday to Friday
**Daily break 9pm to 10pm
Index | Exchange hours* | Our hours (via CFDs)** |
US 500 | 2:30pm – 9pm | Sunday 12am – Friday 9pm |
US Tech 100 | 2:30pm – 9pm | Sunday 12am – Friday 9pm |
UK 100 | 8am – 4:30pm | Sunday 12am – Friday 9pm |
Germany 40 | 8am – 4:30pm | Sunday 12am – Friday 9pm |
Japan 225 | 12am – 6am | Sunday 12am – Friday 9pm |
Australia 200 | 12am – 6am | Sunday 12am – Friday 9pm |
*Monday to Friday
**Daily break 9pm to 10pm
Exchange hours reflect the official market sessions. However, many brokers offer extended trading via CFDs – typically from late Sunday evening to Friday night (UTC), with short maintenance breaks. This allows traders to access global indices throughout most of the trading week.
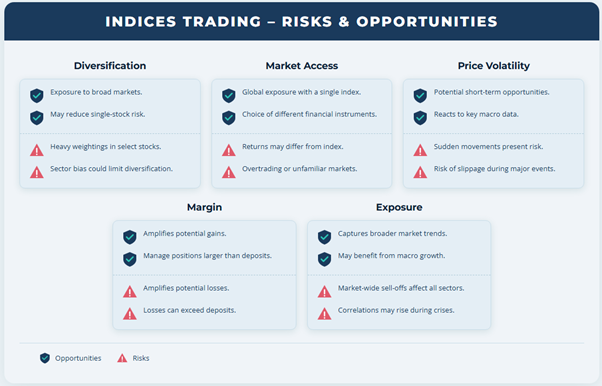
Indices trading carries both potential opportunities and risks, influenced by factors such as leverage, volatility, and market composition.
Indices can give exposure to a basket of stocks, which may reduce company-specific risk. However, many indices are heavily weighted towards a few large firms or sectors, so diversification benefits can vary.
Indices trading via CFDs allows participation in global markets without owning shares. This provides flexibility and access across regions and time zones. However, it may also lead to overtrading or exposure to unfamiliar markets, and potential returns may differ slightly from the underlying index due to spreads, fees, or other trading costs.
Indices can react sharply to economic data, interest rate decisions, and geopolitical events. Sudden price movements can create short-term opportunities, but also increase the risk of slippage and unexpected losses.
Leverage allows traders to open larger positions with a smaller deposit, magnifying both gains and losses. If your margin drops below the threshold, your broker may reduce or close positions – issuing a margin call if needed.
Unlike individual stocks, indices reflect broader economic conditions. In market-wide sell-offs or periods of extreme uncertainty, correlations between assets can rise, which could limit the protective effect of diversification and heightening exposure to broader downturns.
Indices traders can use a variety of strategies, combining technical and fundamental analysis with effective risk management to identify potential opportunities.
Scalping is a short-term strategy where traders aim to profit from small price movements by placing multiple trades throughout the day. Positions are held for seconds or minutes, often using indicators such as moving averages, RSI or chart patterns on high-liquidity indices like the US 500 or Germany 40.
Trend trading involves identifying and trading in the direction of a broader market move. Traders typically use tools such as MACD or moving averages to confirm trend strength before entering long or short positions on indices such as the UK 100 or US Tech 100.
Swing traders hold positions for several days to weeks, aiming to capture medium-term price moves. Both technical and fundamental analysis are used to guide the timing of potential entry and exit points, often around key levels or economic data affecting index sentiment.
Range trading focuses on indices moving within a defined price band. Traders go long near support and short near resistance, using tools like Bollinger Bands or stochastic oscillators to identify reversal signals.