
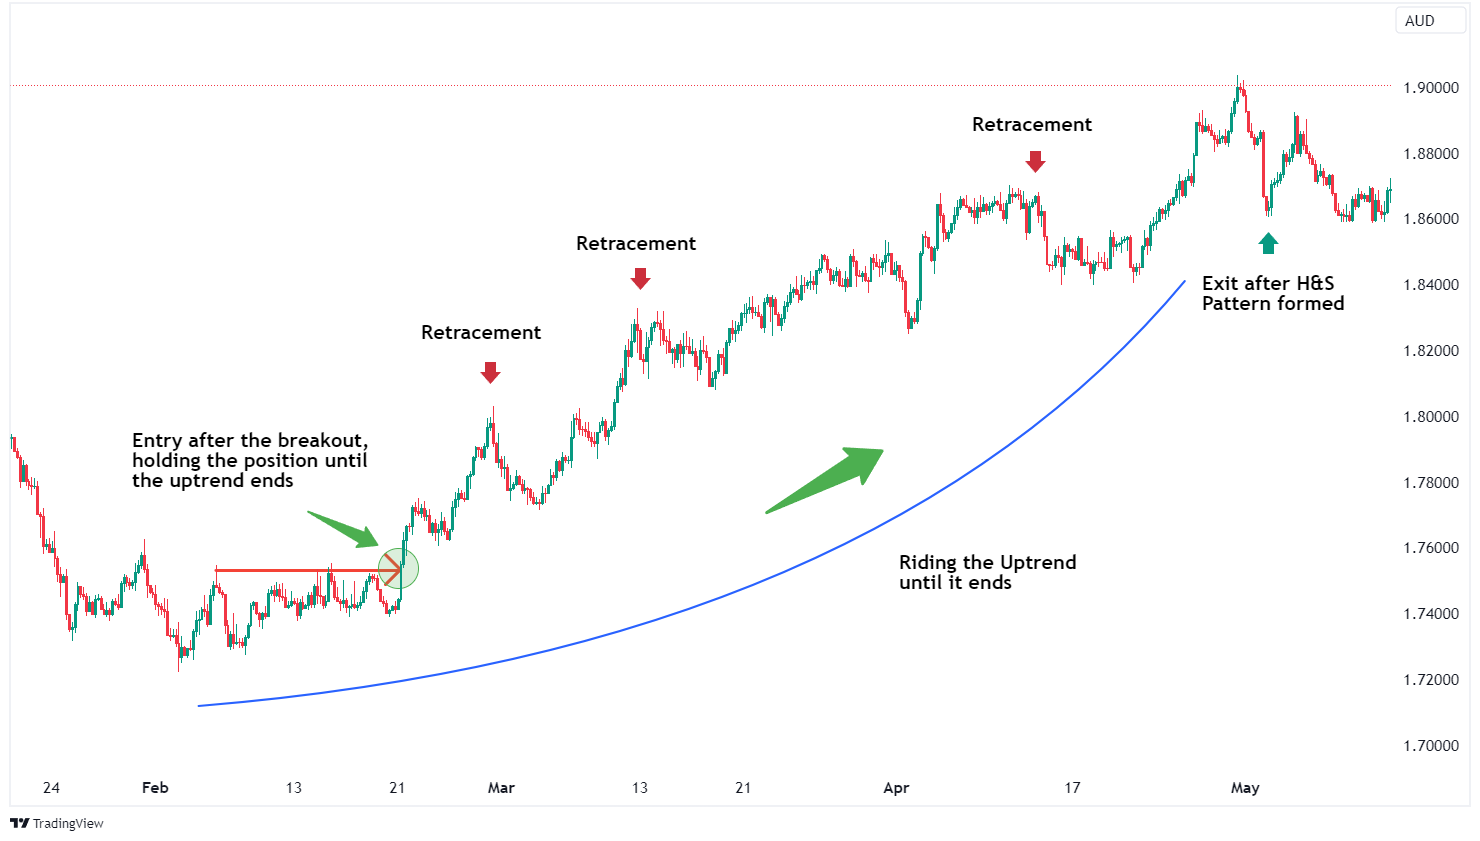
Swing trading refers to the medium-term trading strategy that involves taking a position on a security for a period of a few days to a few weeks, aiming to profit from price swings. Swing trading strategies employ fundamental or technical analysis to determine whether a particular security could go up or down in price in the near future.
Fundamental analysis is a method of analysing securities by examining the underlying economic, financial and other qualitative and quantitative factors that could influence their value.
This may involve keeping aware of the state of the economy, news releases regarding a particular security, analysing a company’s financial statements such as its quarterly earnings reports, and studying market conditions to determine a company’s intrinsic value and potential for future growth.
Technical analysis is a method of analysing price and volume data over specific time frames, to identify trends and forecast future price movements. It is a form of chart analysis that uses historical price data and various chart patterns to identify trends and make predictions about the future direction of markets.
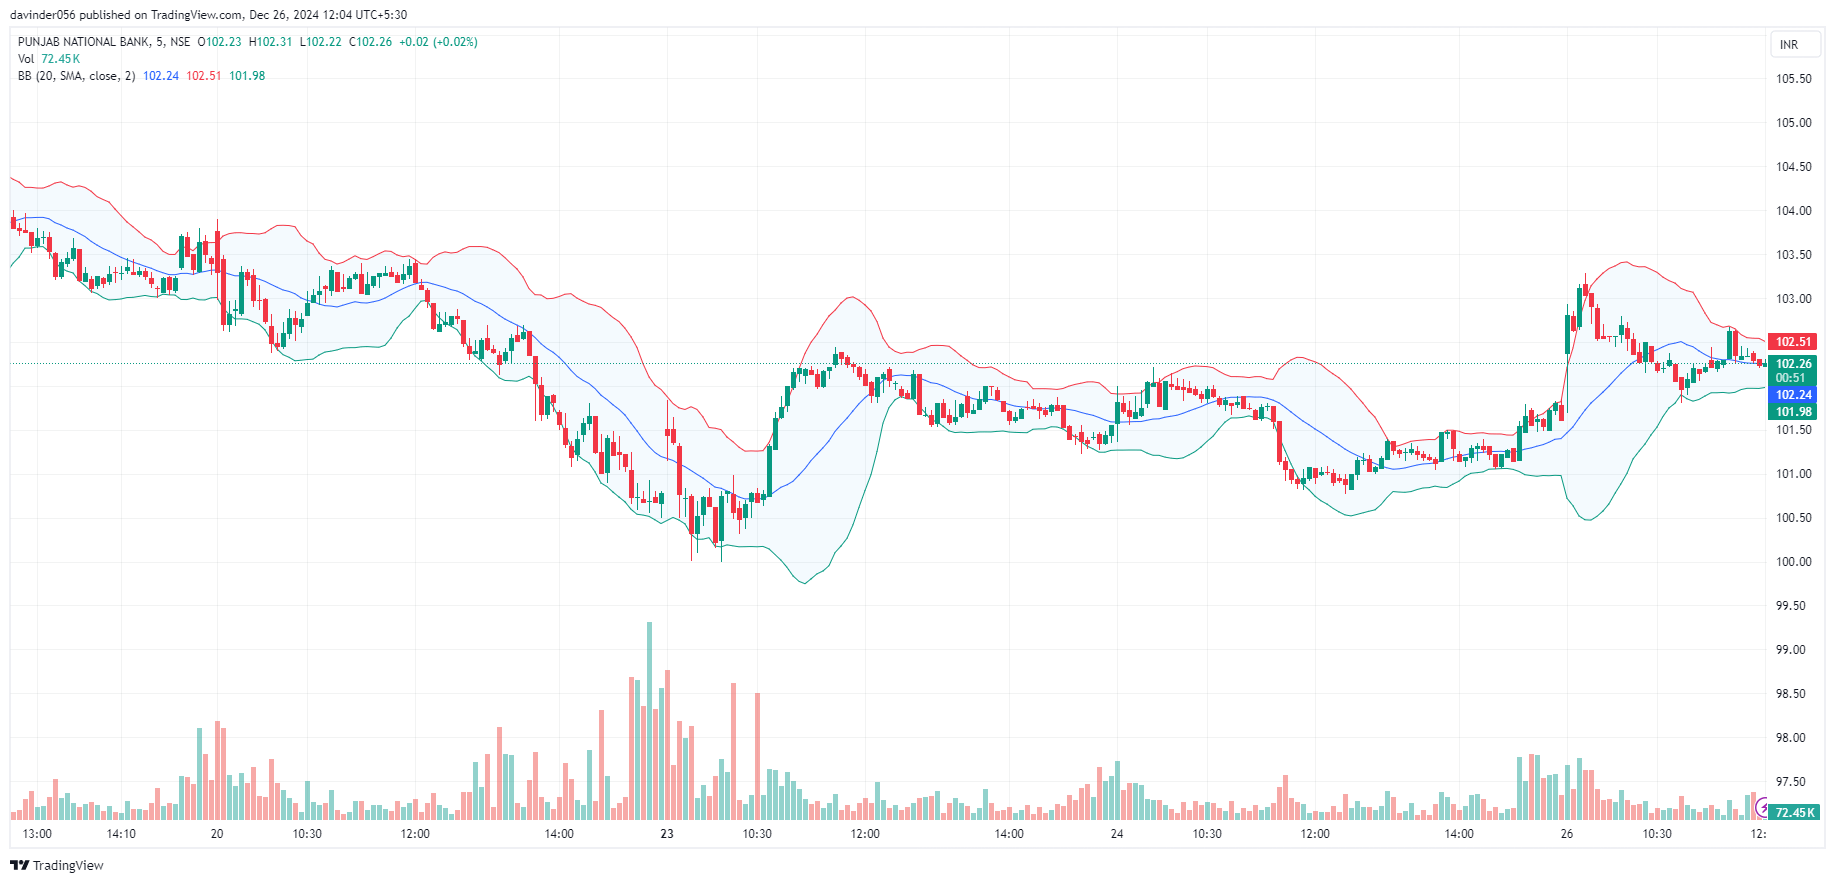
Technical indicators are mathematical calculations that use historical price data and volume data to provide insight into the potential direction of a security. These indicators can be used to identify trends, gauge market sentiment, identify support and resistance levels and more.
Examples of technical indicators include moving averages (MAs), the Relative Strength Index (RSI), Bollinger Bands® and stochastic oscillators.
There are a number of steps a trader could take if they hope to build an effective swing trading strategy.
How do you swing trade? There are several different swing trading strategies often implemented by traders. Below are some of the most popular.
A breakout technique is an approach where a trader takes a position on the early side of the uptrend, looking for a market or stock that is most likely to ‘break out’. The trader gets into the trade as soon as they see the desired level of volatility and movement of a stock that breaks a key point of stock’s support or resistance.
A breakdown strategy is the opposite of a breakout. The market price goes lower than a defined support level and the chart points toward lower prices. Then, traders monitor the same fundamentals as with breakouts.
This swing trading technique uses price-changing momentum when its growth or fall slows down before having a complete reversal.
A concept that is quite similar to reversal. Retracement is applied when the price reverses within a larger trend, but not to its high or for any length of time. A stock temporarily retraces to an earlier price point and then continues to move in the same direction later.
There are many types of financial instruments that can be used for swing trading. As usual, each type has its own advantages and disadvantages. The choice of an instrument depends on the trader’s risk profile, level of experience and present market conditions.
We will list the most popular of the instruments for this type of trading:
Currencies. When working with currencies, the swing trading trader is looking for a particular currency to move in an expected direction (both down and up) in comparison to another currency.
Individual stocks. Another choice for swing trading is with individual company stocks. The idea behind it is exactly the same: swing traders buy a stock for a specific period of time, then sell it for a profit.
Swing trading helps the traders to diversify their investments. Yet, it is important to remember that every trading method has its pros and cons, and it is up to the trader which one of them he or she will choose.
Position trading is a common trading strategy where an individual holds a position in a security for a long period of time, typically over a number of months or years. Position traders ignore short-term price movements in favour of pinpointing and aiming to profit from longer-term trends. It is this type of trading that most closely resembles investing, with the crucial difference being that buy-and-hold investors are limited to only going long.
Out of all the trading strategies, position trading encompasses the longest time-frame.
The potential advantages of position trading can include limited maintenance of positions, capitalising on more substantial trends and dampening the ‘noise’ of the market.

How to use a trend-trading strategy
Position trading involves holding a position open over a long period of time.
Position trading | Day trading | Swing trading | |
Time frame | Long-term | Short-term | Medium-term |
Holding period | Months to years | Within a day | Days to weeks |
Position trading differs from day trading due to the length of time involved. While day traders attempt to open and close their trades within the course of a day, position traders take a longer approach. This could have other implications, such as the amount of money required to reach a profit target.
Likewise, swing trading differs from position trading as it involves holding positions for a few days to a few weeks, with the aim of capturing price movements in what could be described as a medium-term trading strategy. Position trading, meanwhile, largely picks up where swing trading leaves off. Again, swing traders and position traders could often have different goals and utilise different analytic techniques.
Here are some potential benefits of position trading.
There are a range of tools that position traders may consider.
Technical analysis utilises tools that potentially identify patterns and trends that could help traders make informed trading decisions. Traders could use a variety of technical indicators, such as moving averages, relative strength index (RSI), and stochastics, to analyse the market and identify potential entry and exit points.
Another important tool position traders may use is fundamental analysis. This involves analysing macroeconomic data, such as gross domestic product (GDP) growth rates, interest rates, and inflation, as well as company-specific information, such as earnings reports and financial statements. Using fundamental analysis could help traders identify undervalued or overvalued assets.
Risk management may also be a key aspect of formulating a position trading strategy. Traders may consider a variety of tools to manage risk, such as stop-loss orders, which automatically close a losing trade if the price falls below a certain level. Note, however, that an ordinary stop-loss does not protect from slippage. For a fee, a trader may consider a guaranteed stop-loss order, which will close the position regardless of how volatile the market is.
Traders could also consider take-profit orders, which close a profitable position when it hits a particular level of profit a trader is willing to take, and a careful measuring of the risk vs reward ratio.
Position traders may consider taking these steps to design their trading strategy:
Some of the key factors for position traders to consider include:
Long-term outlook: Since position trading involves taking a long-term view, having a strong understanding of market fundamentals, macroeconomic trends, and long-term trends may be important.
Patience: Position trading requires patience, as it could take time for a trade to develop and reach its profit target. Traders should be willing to hold onto their positions even during periods of market volatility.
Position sizing: Determining the appropriate position size may be important for position trading. Traders should ensure they have enough capital to withstand market fluctuations while still having enough buying power to take advantage of market opportunities. Position sizing could also impact risk management, as larger positions may require tighter stop-loss orders
In conclusion, position trading is a form of trading which involves holding a position open for an extended period of time, making it somewhat different from shorter-term strategies such as day trading and swing trading. Position traders may choose to trade a variety of instruments such as CFDs on assets like cryptocurrencies, stocks, forex, commodities or indices.
A position trader could use a variety of technical and fundamental analysis tools, coupled with research, to form a position trading plan.
However, position trading carries a lot of risk with it. Therefore, position traders need to make sure that they conduct their own due diligence, remembering that the market can move against them, and never trade with more money than they could afford to lose.
Trend trading or trend following is a trading strategy that involves identifying the direction of a prevailing trend in the financial markets and then buying or selling assets in accordance with that trend.
Trend traders tend to use technical analysis tools, such as moving averages (MA), trend lines, and momentum indicators, to determine trends in the market. They will look for patterns in price movements and analyse charts to establish areas of support and resistance.
Once a trend has been recognised, trend traders tend to enter a trade in the direction of that trend and the goal is to ride the trend for as long as possible. As a trend trader, you may enter into a long position when the price is trending upward or a short position when the price is trending downward.
The Turtle trading experiment in the 1980s is often credited with popularising the trend-trading system. The experiment was conducted by the legendary commodities trader Richard Dennis, who believed that trading skills could be taught and that anyone could learn to become a successful trader.
Dennis selected a group of inexperienced traders, known as the “Turtles,” and taught them his trend-following system, which involved using technical analysis to identify and trade trends in the markets. The Turtles were taught to use a variety of indicators and risk-management techniques and it was a success.
It’s difficult to estimate exactly how much the Turtle traders made, but some sources state it was over $100 million. Several of the Turtle Traders went on to become successful traders in their own right, including Jerry Parker, who founded Chesapeake Capital and reportedly generated over $1 billion in profits for his clients, and Paul Rabar, who founded Rabar Market Research and reportedly achieved annual returns of over 20% for over two decades.
Note, however, that all trading, including trend following, contains high risk of a loss. Markets move up and down, trends reverse, and past performance is not a guarantee of future results.
There are several types of trends trend followers may want to be aware of.

Traders may choose to use a combination of trend-trading strategies, depending on their style and risk tolerance.
This strategy involves using the moving average (MA) indicator, which measures the average price of an asset over a specified time period.
A trader may look for a “golden cross” signal, this occurs when a short-term moving average (eg 50-day) crosses above a long-term moving average (eg 200 day). This signal may be seen as a bullish indication that the trend is shifting upwards.

Trend lines connect the highs and lows of an asset’s price movements. They are straight lines that connect two or more price points on a chart, representing the direction and slope of a trend.
Trend lines can be used to pinpoint the direction of a trend. They can also be used in conjunction with other technical indicators and candlestick patterns to spot potential trading scenarios. For example, a trader may look for a bullish chart pattern, such as a double bottom, to form near an uptrend line, which may indicate a bullish momentum.

Momentum indicators are used to measure the strength of a trend and can help traders identify potential entry and exit points.
The indicators used are:
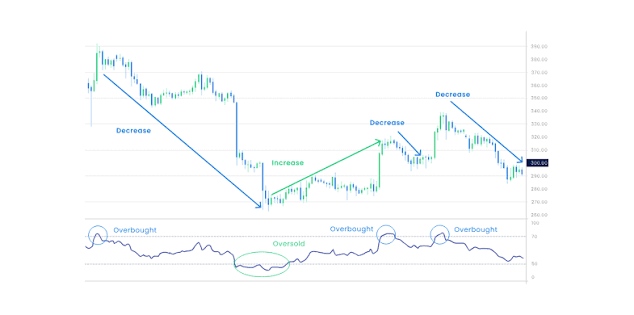
The chart above highlights activity over a few weeks and shows the 9-day moving average and 21-day moving average, trendlines and the RSI indicator below.
When the RSI falls below 30, indicating that the asset is oversold and a trend reversal is likely, it’s followed by a cross of 9 and 21-day moving averages, which too signals a potential bullish trend reversal. A trend-trader may have decided to buy the asset since there are two indicators confirming the reversal, and followed the trend until RSI shoots above 70, suggesting the asset is overbought.
The key steps involved in trend trading include:
Identifying trends: The first step in trend trading is to find out the direction of the trend. This can be done by analysing price charts and looking for higher highs and higher lows in an uptrend or lower lows and lower highs in a downtrend. Technical indicators such as moving averages and trend lines can also be used to highlight trends.
Selecting entry and exit points: Once a trend has been identified, the next step is to select entry and exit points. Entry points can be determined using technical indicators such as momentum oscillators and chart patterns.
Managing risk: Risk management is an important aspect of trend trading. Traders can use appropriate position sizing and risk-management techniques. Stop-loss orders can be used to limit potential losses. It should be noted that ordinary stop-losses do not protect from slippage, while guaranteed stop-losses do, however there is a fee associated with them.
In summary, trend trading is a widely employed and adaptable trading strategy, which focuses on capitalising on market momentum through the identification and pursuit of prevailing trends.
Using technical analysis tools, such as moving averages, trend lines, and momentum indicators, traders can ascertain trends and evaluate their potential potency. By recognising the distinct types of trends – secular, primary, secondary, intermediate, and minor – traders can adapt their strategies for varying market conditions and timeframes.
Trend-following strategies may use moving averages, trend lines, and momentum indicators, including to establish entry and exit points while assessing a trend’s strength. The versatility of trend trading allows its application across diverse financial markets, including stocks, cryptocurrencies, forex, commodities, and indices.
Day trading is the practice of buying and selling financial instruments within the course of a day. A day trader typically starts trading when the market opens and finishes when the market closes. The idea is to speculate on small price movements.
Day traders can speculate using a variety of instruments from financial derivatives to assets such as stocks, foreign exchange, indices and commodities.
Day trading is based around a market or asset’s price fluctuations. This means that, in many cases, traders may consider assets that move around, meaning there are more fluctuations. The relative liquidity of an asset is also something day traders may consider keeping in mind.
Derivatives, such as contracts for difference (CFD) are popular instruments for day trading, as they allow short selling and the use of leverage (restrictions may apply), which can magnify both profits and losses.
CFDs allow traders to speculate on the price movement without owning the underlying asset.
There are a range of strategies that traders could consider to day trade. These include, but are not limited to:
Key indicators | Key concept | |
Range trading | Support and resistance; Commodity channel index (CCI) | Identifying highs and lows of an asset’s price during the day (range) to inform entry and exit points. |
Contrarian trading | Investor sentiment indicators | Trading against prevailing market sentiment, for example, buying in a bear market and selling in a bull market. |
Breakout trading | Moving average convergence divergence (MACD), relative strength index (RSI), volume indicators, and other oscillators | Trading assets that broke out of their trading range – outside support and resistance – coupled with a strong momentum. |
News trading | Fundamental analysis; earnings reports; economic readings | Trading based on the news that affects asset prices rather than based on technical analysis. |
Mean reversion trading | Moving averages (MA); MACD, RSI | Identifying assets in an uptrend, buying the pullback, and selling the rally. Or vice versa for short-selling. |
Pairs trading | Historical correlation of two securities | Trading two related assets in the market and opening a long position on one and a short position on the other to speculate on a trend that affects both. |
The rules of day trading vary from place to place, depending on which jurisdiction a trader is under. Make sure to conduct your own research, looking at the government websites and other official sources.
There are, however, market risks that are universal. Markets can move against a trader’s position. If this happens, a trader could lose their money. When learning to day trade make sure to also conduct due diligence on the asset you’re trading. Remember that prices can move against your position, and never trade with more money than you can afford to lose.
How to start day trading
You may consider taking these steps to start day trading:
Day trading example
A potential example of day trading stocks comes in the form of Tesla’s (TSLA) performance on 14 February 2023.
Following the news that a senior analyst at Barclays initiated stock coverage, giving it a “Buy” rating and a $275 price target (versus $192 share price on the day), the stock went up by more than 7% in the course of the day, reaching as high as 9% increase intraday.
A day trader could have entered the market by buying Tesla when it opened at $191.94, around the time that the analyst made his forecast, and exited the market by selling it when it reached its intraday high of $209.25.
Note that this example is for illustrative purposes only. Of course, if the stock didn’t react to the rating, or reacted differently, the trader could have lost money.
Things to watch out for when day trading
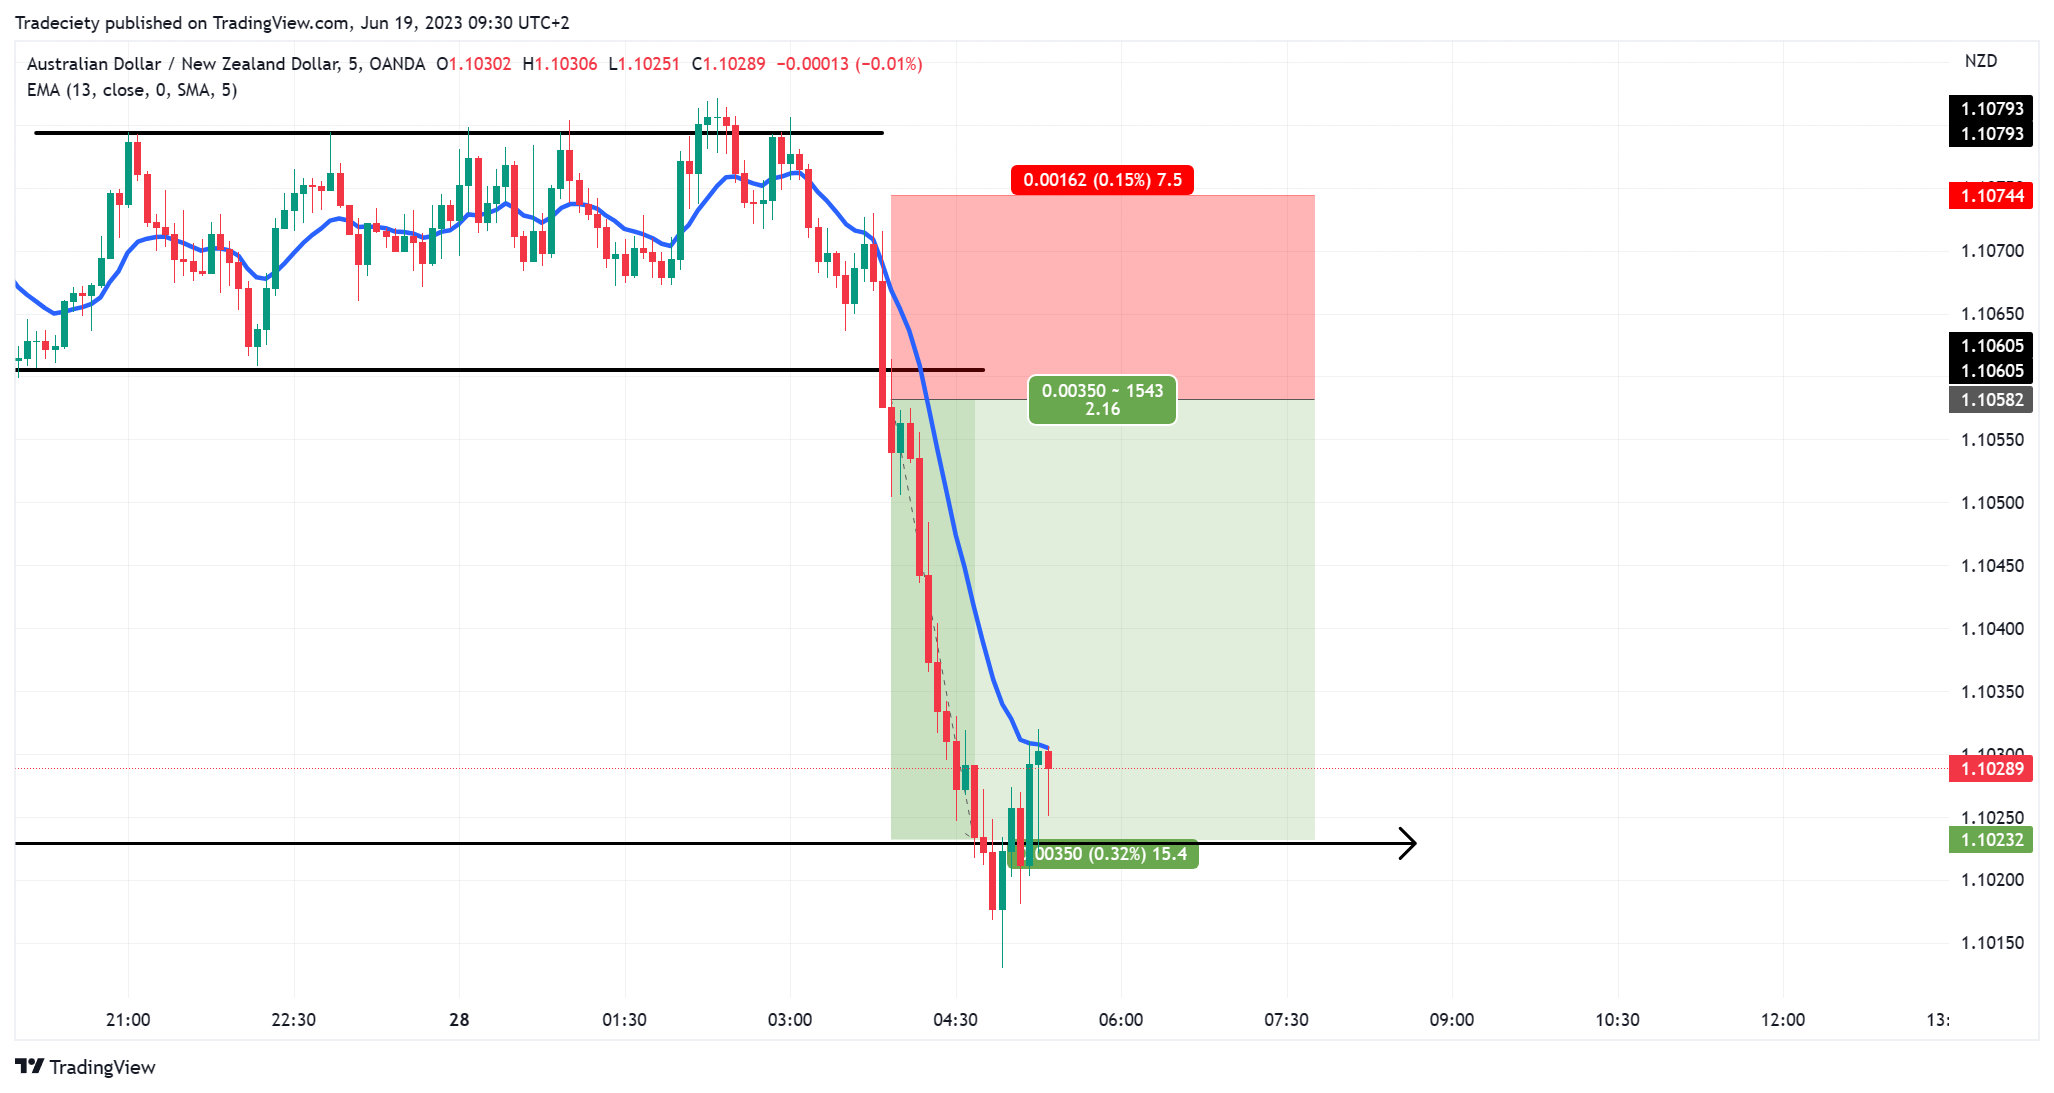
The are a few mistakes traders could avoid when day trading:
Day trading refers to a trading approach in which a position is open and closed within the same trading session or day. Day trading strategies include, but are not limited to, range trading, contrarian trading, pairs trading and news trading.
To start day trading, you may consider choosing an instrument you want to trade (for example via derivative products); then open a brokerage account, and design a trading strategy that’s suitable to your goals. Day traders may benefit from doing their own research, avoid trading illiquid assets and keeping their emotions under control.
Day trading carries a lot of risks. This is why you may need to do your own research, remember that prices can go down as well as up, and never trade more money than you can afford to lose.